Every ICM application I have implemented offer an interface to browse through the results. This is usually a GREAT tool to troubleshoot and to resolve issues, but it's rarely the best and quickest tool to analyze results in bulk. Fortunately, every ICM application I have seen also have a functionality to export the results. Exporting the results will create a file locally which can then be opened by a program such as Excel or Access for further analysis. I will discuss how to use Excel to review the results, and later I will create another quick tutorial on using Access.
Step 1) Export the Results from your ICM System
Every system has its own way of doing this, but generally this should be doable from the interface and not requiring a database administrator to pull the data from the database (although this can also be done if required).
Step 2) Import the Data in Excel
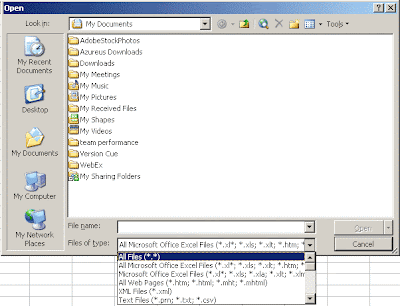
First, open Excel and click on File->Open. Click on the dropdown menu beside "Files of type" and click on "All Files".
 Find the location where you saved the exported file of step 1 and click on "Open".
If the file is a .CSV file, Excel will automatically place the data in columns. If the file is a .TXT file, more steps are required (see step 3).
Step 3: Opening a Delimited Text File in Excel
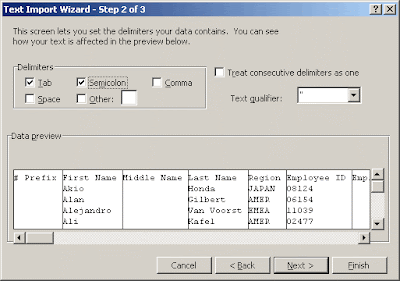
In the first Wizard step, choose "Delimited" and click on "Next". In Step 2, select the character used to delimit each column (Xactly uses semi-colons). Click "Next" twice and the data will be imported in columns.

Step 4: Filtering the Result Data
At this point we have a worksheet with all of our result set displayed. Each of the column can be sorted and the search feature can be used to quickly find a specific order. However there is another trick which allows to quickly display data for a specific rule, result name, person, date, etc.
Click on Date->Filter->AutoFilter
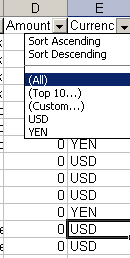
This will make the first row (usually column names) dropdown menus which will contain all the values contained within the column. In the example below, the drop-down for column "Currency" allows to choose "USD" and "YEN". Choosing USD will filter out all the other currency types.

Filtering can be done in this manner for multiple columns at the same time. For example you could filter a certain position (Julien Dionne), and further filter to display only the USD currency.
Quick Summation
Summing credit and commission amounts is one of the most frequent activity I perform when testing.
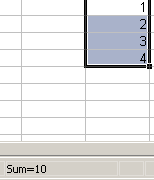
Excel has a built in feature which allows to quickly find out the sum of selected cells. By simply highlighting the cells containing a number or a dollar amount, the total value of these cells will be displayed in the bottom-right corner of the window.

Additional Notes
Excel offers more advanced functionalities such as Pivot Tables. They can be useful when reviewing a large volume of results. I will discuss this in more details in the future.
Excel Limitations
Excel cannot have more than 65536 rows. If the result set exceeds this, it will not get imported. It is possible to "workaround" this issue by only importing a subset of data (maybe by restricting the incentive period). MS Access could also be used instead of Excel and would not be subject to this limit. I will discuss using Access to review results in the near future.


No comments:
Post a Comment